Trial 2 · revised water
Requested w/b 0.420375.5 kg/m³ binder157.7 kg/m³ free water · actual w/b 0.420Proposed only · measure workability and strength.
THE CONCRETE MIX DESIGN LAB
Choose a grade. Set your quantity. See every ingredient, then explore the science behind your concrete mix ratio.
M30 means 30 MPa characteristic cube strength at 28 days. Each grade needs a material-specific mix; it has no single fixed ratio.
Design volume. No waste allowance is added automatically.
Sum of all materials to weigh
1,000 litres
Quantities for your 1 m³ batch · Preliminary trial
Sand and stone include their entered moisture. Water is the amount to add at the mixer; water already in aggregates and admixture is accounted for.
Based on example material properties. Confirm performance with physical trials; actual yield needs measured fresh density.
GO DEEPER
Review the material assumptions, follow each calculation and prepare a physical trial.
YOUR MIX, EXPLAINED
01 / COMPOSITION
Absolute volume uses specific gravity. It is not loose bucket volume. ¹ Water carried by an admixture stays within its product share.
02 / STRENGTH RELATIONSHIP
Approximate Figure 1 readings · 28-day cube strength
The curves are an approximate redraw of IS 10262:2019 Figure 1, not measured results for your mix. SCM blends need material-specific trials.
Total binder : fine aggregate : coarse aggregate.
This proportion belongs to these inputs; it is not a universal M30 recipe.
DESIGN WITH THE CURVE
Drag the target points. Explore a sand–stone blend. See the batch change.
The cumulative curve can hide a gap or a concentration. These bars show mass between adjacent sieves, including pan and oversize. A close target fit does not establish packing density or workability.
For an interval: passing at the larger sieve − passing at the smaller sieve. All fractions sum to 100.0%. These are user targets, not a specification envelope. FHWA-sponsored grading research ↗
2.3 percentage points RMS difference from your target
One blend share must work across every sieve; some target shapes cannot be matched exactly.
LIVE BATCH PREVIEW
| Quantity | Current mix | Proposed | Change |
|---|---|---|---|
| Sand · as batched | 684.6 | 684.6 | — |
| Stone · as batched | 1236.9 | 1236.9 | — |
| Water to add | 157.7 | 157.7 | — |
| Total binder | 375.5 | 375.5 | — |
Binder and free-water target stay fixed. Aggregate volumes and wet batching quantities are recalculated using your SSD specific gravities, absorption and moisture.
Cumulative percent passing by oven-dry mass. Editing source values marks them as user-entered; no laboratory verification is implied.
| Sieve mm | Sand % | Stone % | Target % | Blend % |
|---|---|---|---|---|
| 0.075 | 0.5 | |||
| 0.15 | 2.0 | |||
| 0.3 | 5.6 | |||
| 0.6 | 14.7 | |||
| 1.18 | 23.4 | |||
| 2.36 | 30.8 | |||
| 4.75 | 37.7 | |||
| 10 | 56.2 | |||
| 20 | 97.4 | |||
| 40 | 100.0 |
For each sieve, blend passing = x × sand passing + (1 − x) × stone passing, where x is the sand fraction of oven-dry aggregate mass. Fit target finds the least-squares fraction across all displayed sieves, limited to 1–99% sand in this application.
For volume accounting, each dry share is multiplied by (1 + absorption) and divided by its bulk SSD specific gravity. The resulting volume fractions allocate the available aggregate volume. The fitted share replaces the IS table split and its optional coarse reduction.
The editable target and example curves are exploratory. This is not an IS 383 grading-envelope check, packing-density optimization or strength prediction. Constituent suitability, water demand, workability and physical trials still need evaluation.
Reference: combining aggregate gradations, Iowa DOT IM 531EXPERIMENT / PREDICT QUANTITIES, THEN TEST PERFORMANCE
Pin a mix, choose what stays fixed, then move the ratio. The candidate stays separate until you apply it.
Green: no action-level limit triggered. Amber: a governing limit or design action needs review. The plotted sweep covers 0.25–0.65; the control allows 0.20–0.70. Any previous binder uplift is already represented in the pinned mass and is not applied again.
| Quantity | Pinned | Candidate | Change |
|---|---|---|---|
| Total free water kg/m³ | 157.7 | 157.7 | 0.0 |
| Total binder kg/m³ | 375.5 | 375.5 | 0.0 |
| Actual water/binder | 0.420 | 0.420 | 0.000 |
| Paste volume L/m³ | 280.2 | 280.2 | 0.0 |
| Fine aggregate · SSD kg/m³ | 684.6 | 684.6 | 0.0 |
| Coarse aggregate · SSD kg/m³ | 1236.9 | 1236.9 | 0.0 |
| Mixer water kg/m³ | 157.7 | 157.7 | 0.0 |
Admixture water contribution is set to 0%. Enter the supplier’s measured water fraction when applicable; do not assume a liquid product is water-free.
Material data and project conformity still require verification even when no numerical limit is triggered.
After Trial 1, adjust water and/or admixture to address observed workability. Trial 2 retains the preselected ratio; Trials 3 and 4 explore about −10% and +10% of that ratio at the same revised water. Here the pinned actual ratio is the starting value. These are proposed batches, with no assumed strength or slump results. IS 10262:2019 §5.8 ↗
Enter the revised SSD free-water budget. Edit admixture in the main design and re-pin if its dosage also changes.
Proposed only · measure workability and strength.
Proposed only · measure workability and strength.
Proposed only · measure workability and strength.
WATER / FROM MATERIAL CONDITION TO BATCH QUANTITY
Start with the free-water budget, then account for aggregate moisture and the water inside liquid admixture. Quantities below follow the current design.
157.73 + (0.00) + (0.00) + 0.00 = 157.73 kg/m³
Amber negative contributions represent absorption demand. They increase the water to add. This diagram shows signed amounts; bar lengths represent magnitude.
MOISTURE ERROR EXPERIMENT / FROZEN BATCH TICKET
Keep the ticket’s wet aggregate weights and mixer water unchanged. Change the actual moisture to see the resulting water and dry-solids errors. Recalculating the correction here would hide the error.
Mass errors are per frozen ticket sized for 1 m³; its actual yield is unknown. Actual dry sand = 684.65 ÷ (1 + 1.0 / 100) = 677.87 kg. The binder mass stays fixed. Absorption demand is an SSD accounting assumption, not a model of absorption rate.
TRIAL NOTEBOOK / EVIDENCE FROM YOUR MATERIALS
Enter test results and actual batch quantities. Each record keeps its material identity, testing conditions and the current proposed design snapshot.
All numbers below are measurements or user declarations. Default design values are not copied into measured fields. Keep one material series for the same constituent sources and proportions; start another when they change.
Identify the binder, aggregate and admixture family.
Supplier, lab report IDs and material dates.
Describe actual curing; different conditions plot separately.
Comma-separated measurements, e.g. three replicate values. The arithmetic mean is descriptive, not a code acceptance check.
Mixer + aggregate free moisture + admixture water + any later additions; exclude absorbed water.
Cement plus all cementitious additions, for that same physical batch.
Declare the intended volume of this physical trial batch. The current proposed design is 1.000 m³.
Use the actual total mass charged to the batch and measured fresh density. Calculated volume closure does not establish actual yield. NRMCA CIP 8 ↗
No demonstration test results are prefilled. Record a batch to compare measured w/b and strength.
Absolute-volume closure: 1.000000 m³. Durability minimum: 300 kg/m³; maximum water/OPC: 0.50; actual: 0.420. Effective w/b ceiling: 0.500. These are selected checks, not a compliance certificate.
Admixture water contribution is set to 0%. Enter the supplier’s measured water fraction when applicable; do not assume a liquid product is water-free.
Strength reference readings, admixture reduction and material properties require trial verification. Sulphate exposure, chloride limits, constituent conformity and project-specific requirements need separate checks.
IS 10262:2019 ordinary/standard grade workflow · Selected IS 456:2000 durability provisions · Physical trials and project review required.
Engine 1.3.0; 1 m³; Moderate exposure; reinforced concrete. Preliminary trial only.
| Constituent | Per m³ · kg | Your 1 m³ batch · kg |
|---|---|---|
| Cement | 375.543 | 375.543 |
| Fine aggregate (as batched) | 684.646 | 684.646 |
| Coarse aggregate (as batched) | 1,236.877 | 1,236.877 |
| Water to add at mixer | 157.728 | 157.728 |
| Chemical admixture | 3.755 | 3.755 |
| Total batch mass | 2,458.550 | 2,458.550 |
f′ck = max(fck + 1.65S, fck + X)
max(30 + 1.65 × 5.00, 30 + 6.50) = 38.25 MPa
Assumed standard deviation 5.00 MPa. The larger margin governs; characteristic and target strengths are different. (IS 10262:2019 · 4.2, Tables 1–2)
r = min(selected w/b, maximum w/c × credited binder fraction)
min(0.42, 0.50 × 1.000) = 0.420
The ratio is interpolated from approximate Figure 1 readings and rounded down to 0.01. It is a preliminary selection, not a measured strength prediction. (IS 10262 · 5.1 / IS 456 · Table 5)
W = (W₀ − shape adjustment) × slump factor × (1 − reduction)
(186 − 0) × 1.060 × 0.80 = 157.7 kg/m³
The starting water estimate is for SSD aggregates. The 3% change per 25 mm slump and admixture reduction are preliminary; actual workability must be measured. (IS 10262 · 5.3, Table 4)
B = max((W ÷ r) × trial increase, durability minimum)
max((157.73 ÷ 0.420) × 1.00, 300.00) = 375.5 kg/m³
Final w/b is 0.420 after minimum-content or trial adjustments. Durability water/OPC is 0.420 against 0.50. Replacement percentages are fractions of total binder mass. (IS 10262 · 5.4 / IS 456 · Tables 5–6)
Vagg = 1 − Vair − Σ [mᵢ ÷ (Gᵢ × 1000)]
1 − 0.0100 − 0.2802 = 0.7098 m³
Use specific gravity, not loose bulk density. Water carried inside the chemical admixture is counted once, within that product’s volume. (IS 10262 · 5.2, 5.7)
pCA = [p₀ + 0.2(0.50 − w/b)] × (1 − reduction)
[0.62 + 0.2 × (0.50 − 0.420)] × 1.00 = 63.6% coarse / 36.4% fine
SSD masses: fine 684.6 kg and coarse 1236.9 kg per m³. The optional reduction is a trial adjustment up to 10%, not an automatic pumpability guarantee. (IS 10262 · 5.5, Table 5)
mOD = mSSD/(1+A); mwet = mOD(1+MC); Wsurface = mOD(MC−A); Wmixer = Wfree − Wsurface,sand − Wsurface,stone − Wadmixture
Sand surface water: 677.9 × (1−1)/100 = 0.00; stone surface water: 1230.7 × (0.5−0.5)/100 = 0.00; mixer water: 157.73 − (0.00) − (0.00) − 0.00 = 157.7 kg/m³ mixer water
All water quantities above are kg per m³. A and MC are fractions in the formula; entered percentages are divided by 100. Total moisture and absorption use an oven-dry mass basis. Surface water 0.0 kg plus admixture water 0.0 kg is deducted from the free-water budget. Negative surface water represents aggregate absorption demand. (SSD mass balance · IS 10262 Annexes A–B)
Batch quantity = quantity per m³ × batch volume
Each constituent × 1.000 m³ = 1.000 m³ trial batch
Measure workability, fresh density, yield and strength; inspect segregation and bleeding. Revise the mix and record trials before project approval. (IS 10262 · 5.8)
Admixture water contribution is set to 0%. Enter the supplier’s measured water fraction when applicable; do not assume a liquid product is water-free.
Verify applicable code editions, material tests and project requirements. Reference graph is approximate, not measured mix performance.
UNDERSTAND YOUR RESULTS
A concrete mix design calculator estimates how much cement, water, sand and coarse aggregate a trial needs. Start with the project standard and material evidence; the resulting concrete ratio belongs to those inputs.
Mix design determines the proportions of the ingredients. A concrete volume calculator answers a different question: how many cubic metres fit the slab or footing dimensions. Calculate that volume first if needed, then use it to scale the selected mix. Neither calculation chooses the structural dimensions for you.
Calculate slab or footing volume →A ratio such as 1:2:4 names the relative amounts of cement, sand and stone on a stated measurement basis. It does not include the water automatically. A ratio measured by mass cannot be reused as the same numbers of loose buckets: bulk density, packing and sand moisture change that conversion.
Read the concrete mix ratio guide →Indian M grades, UK cylinder/cube classes and US cylinder strengths describe different specification and test contexts. Choose the construction project’s method even if you are browsing from another country. Each regional worksheet states which calculations it implements and which project requirements you must supply.
Compare the methods and their scope →Batch weights tell you what to weigh. Absolute volumes describe how the constituents share the designed concrete volume; they are not loose delivery volumes. Water to add at the mixer also differs from total free water when aggregates or liquid admixtures contribute water. Use the calculation steps to trace those differences before preparing a trial.
Explore the water-cement ratio calculation →UNDERSTAND THE METHOD
A concrete grade describes characteristic strength. It does not define a fixed ingredient recipe. Mix design brings strength, workability and durability together using the materials actually available.
Concrete mix ratio guide: grade table, mass versus volume and worked quantities →
Specify grade, exposure and workability. Test constituent specific gravities, aggregate grading, absorption and moisture.
Choose a trial ratio from material evidence, check durability, estimate workability water and calculate the binder demand.
Subtract paste and air from one cubic metre. Allocate the remainder to aggregates and correct the batch for moisture.
Measure slump, density and strength. Inspect bleeding and segregation, adjust the design and repeat with the actual materials.
VOLUME ≠ MASS
Specific gravity connects mass to absolute volume. At a specific gravity of 3.15, 31.5 kg of cement occupies 10 litres of absolute solid volume. Loose powder also contains spaces between particles, so its bucket volume is different.
Method reference: IS 10262, clause 5.7Equal absolute volume: 10 L each · illustrative specific gravities
A VISUAL GUIDE TO THE MIX
Start with the ingredients, then see why wet aggregate changes the batch. These concepts support every regional worksheet.
Four main ingredients, each with a different role.

Some mixes also use supplementary cementitious materials and chemical admixtures. Air occupies volume too. Their amounts depend on the specification, materials and trials.
The surface and the pores tell different stories.

Air-dry aggregate lies between oven dry and SSD. Measure absorption and total moisture; appearance alone cannot determine the correction.
Illustrative example, separate from your mix: 100 kg of oven-dry sand, 2% absorption and 5% total moisture. Both percentages use oven-dry mass.
The reference mass
100 + 2 absorbed water
100 + 5 total water
105 − 102 = 3
Batch 105 kg of wet sand to supply 102 kg on an SSD basis. Deduct 3 kg from the water otherwise added at the mixer. Account separately for moisture in other aggregates and water in liquid admixtures.
Learn more: NRMCA · aggregate moisture and ACI · batch water adjustments.
From SSD to wet batch weights: follow a complete moisture correction →
MATERIAL SCIENCE
Small differences in the raw materials can change water demand, packing, workability and the measured strength.
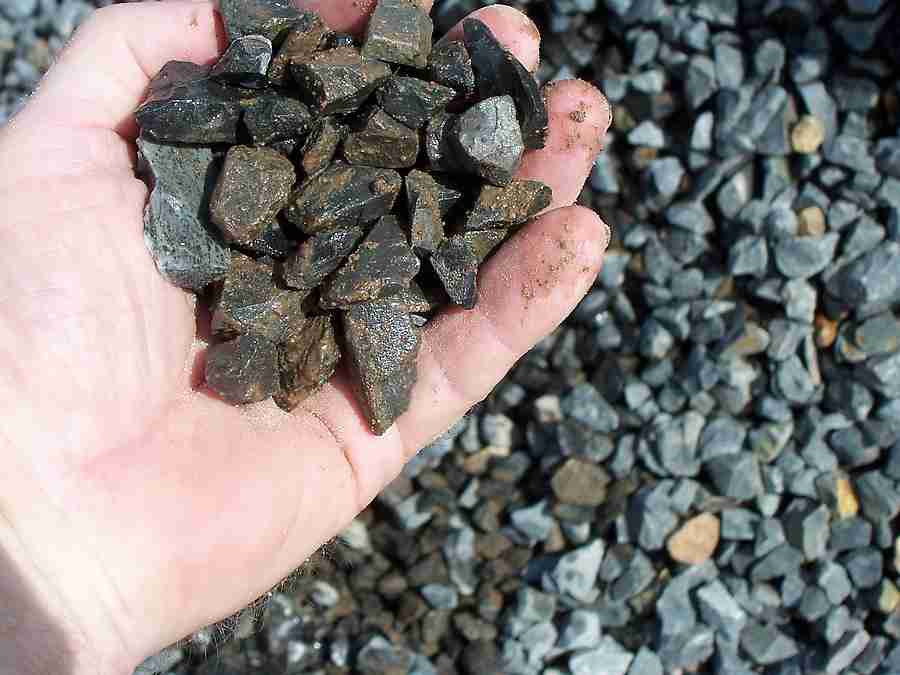
The aggregate skeleton controls how much paste is needed between particles. Grading zones, shape and surface texture inform a starting mix; a trial confirms its workability.
Supplementary materials change binder chemistry and particle packing. Their contribution depends on source, dosage and curing. A replacement percentage alone cannot establish strength or durability.
Dosage and water reduction are separate inputs. Use supplier information and compatibility trials, and include water carried by liquid products in the water balance.
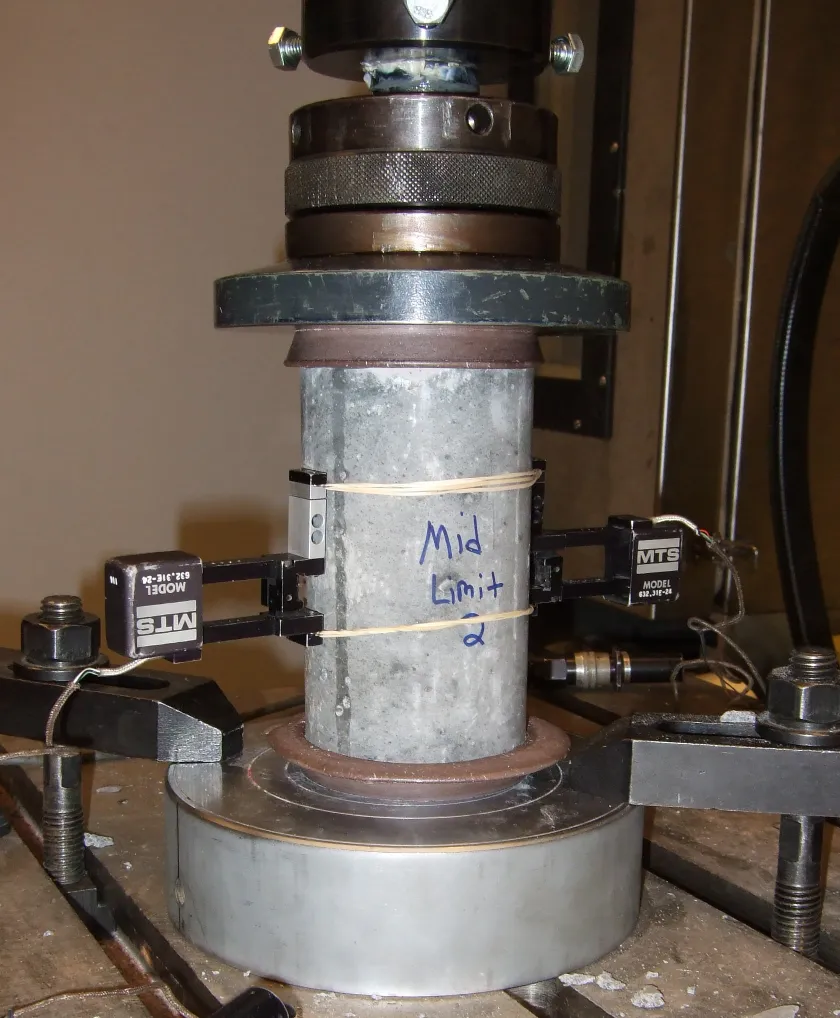
THE FINAL STEP IS PHYSICAL
Keep specimen shape, test age, curing and test method consistent when comparing results. Indian M grades use characteristic cube strength; cylinder strengths and international class labels are not interchangeable.
Photo shows general laboratory cylinder testing, not an M-grade cube test. Xb-70 / Simpson Gumpertz & Heger, Inc. · Public domain.
THE STANDARDS BEHIND THE PROCESS
This calculator implements the ordinary/standard grade IS workflow. Separate US ACI and UK BS/EN trial worksheets use their own inputs and stated limits. Choose the project standard above; the methods are not interchangeable.
Concrete mix proportioning. Target strength, water, binder, air, aggregate allocation and trial procedure.
Read source text Third-party copy reviewed; © BIS. Verify the applicable edition and amendments through BIS.Selected exposure-based limits for water/cement ratio, minimum content and grade. Project requirements may be stricter.
View referenced provisionsIS 383: aggregates; IS 2386 Part 3: specific gravity and absorption; IS 9103: admixtures. Relevant parts of IS 1199 and IS 516 govern fresh and hardened testing.
Find applicable BIS standardsMixture-proportioning guidance using absolute volumes. ACI structural requirements and applicable ASTM test methods have distinct roles.
ACI guideConcrete specification, performance, production and conformity, with national provisions. Verify the locally adopted edition, including the 2026 EN 206 revisions.
BSI referenceMaterials, construction and testing requirements. Exposure classes and test conventions need their own implementation.
CSA GroupConcrete specification and supply, and concrete test methods. These references do not convert an Indian trial into an Australian-compliant mix.
Standards AustraliaSpecial mixes—self-compacting, mass, fibre-reinforced, lightweight and M65+ high-strength concrete—need additional methods and tests. The present calculator does not certify those designs.
A FEW IMPORTANT DISTINCTIONS
Select M20 or M30 in the grade grid and enter your required concrete volume. The calculator estimates binder, sand, stone and water from the design brief and material properties. Review exposure, moisture and the calculation steps before making a physical trial. The displayed proportion is specific to those inputs.
Set the concrete quantity to 1 m³. The To weigh view shows each ingredient in kilograms, including moisture-corrected sand and stone and the water to add at the mixer. Change the quantity to scale the same design. The In the mix view shows absolute-volume contributions in litres, not loose bucket quantities.
The grade describes characteristic strength. Mix proportioning uses a higher mean target to allow for variation. The IS 10262 method checks both the statistical margin and the grade-based minimum margin.
No universal ingredient proportion establishes these grades. Strength, exposure, workability and actual material properties determine a trial mix. The calculated ratio shown here changes with your inputs.
A lower ratio can support higher strength for a given material system, but the concrete must still be workable, placed, compacted and cured properly. A graph cannot account for every production condition.
The SSD design includes water absorbed inside aggregates. Actual stockpiles may be wetter or drier. Correcting both aggregate mass and added water preserves the intended solids and free-water balance.
No. It is a transparent preliminary proportioning and learning tool. The selected code provisions do not replace material conformity checks, physical trials, acceptance testing or project-specific professional approval.